Dashboard
The main dashboard provides a real-time overview of your energy observability platform.
Overview
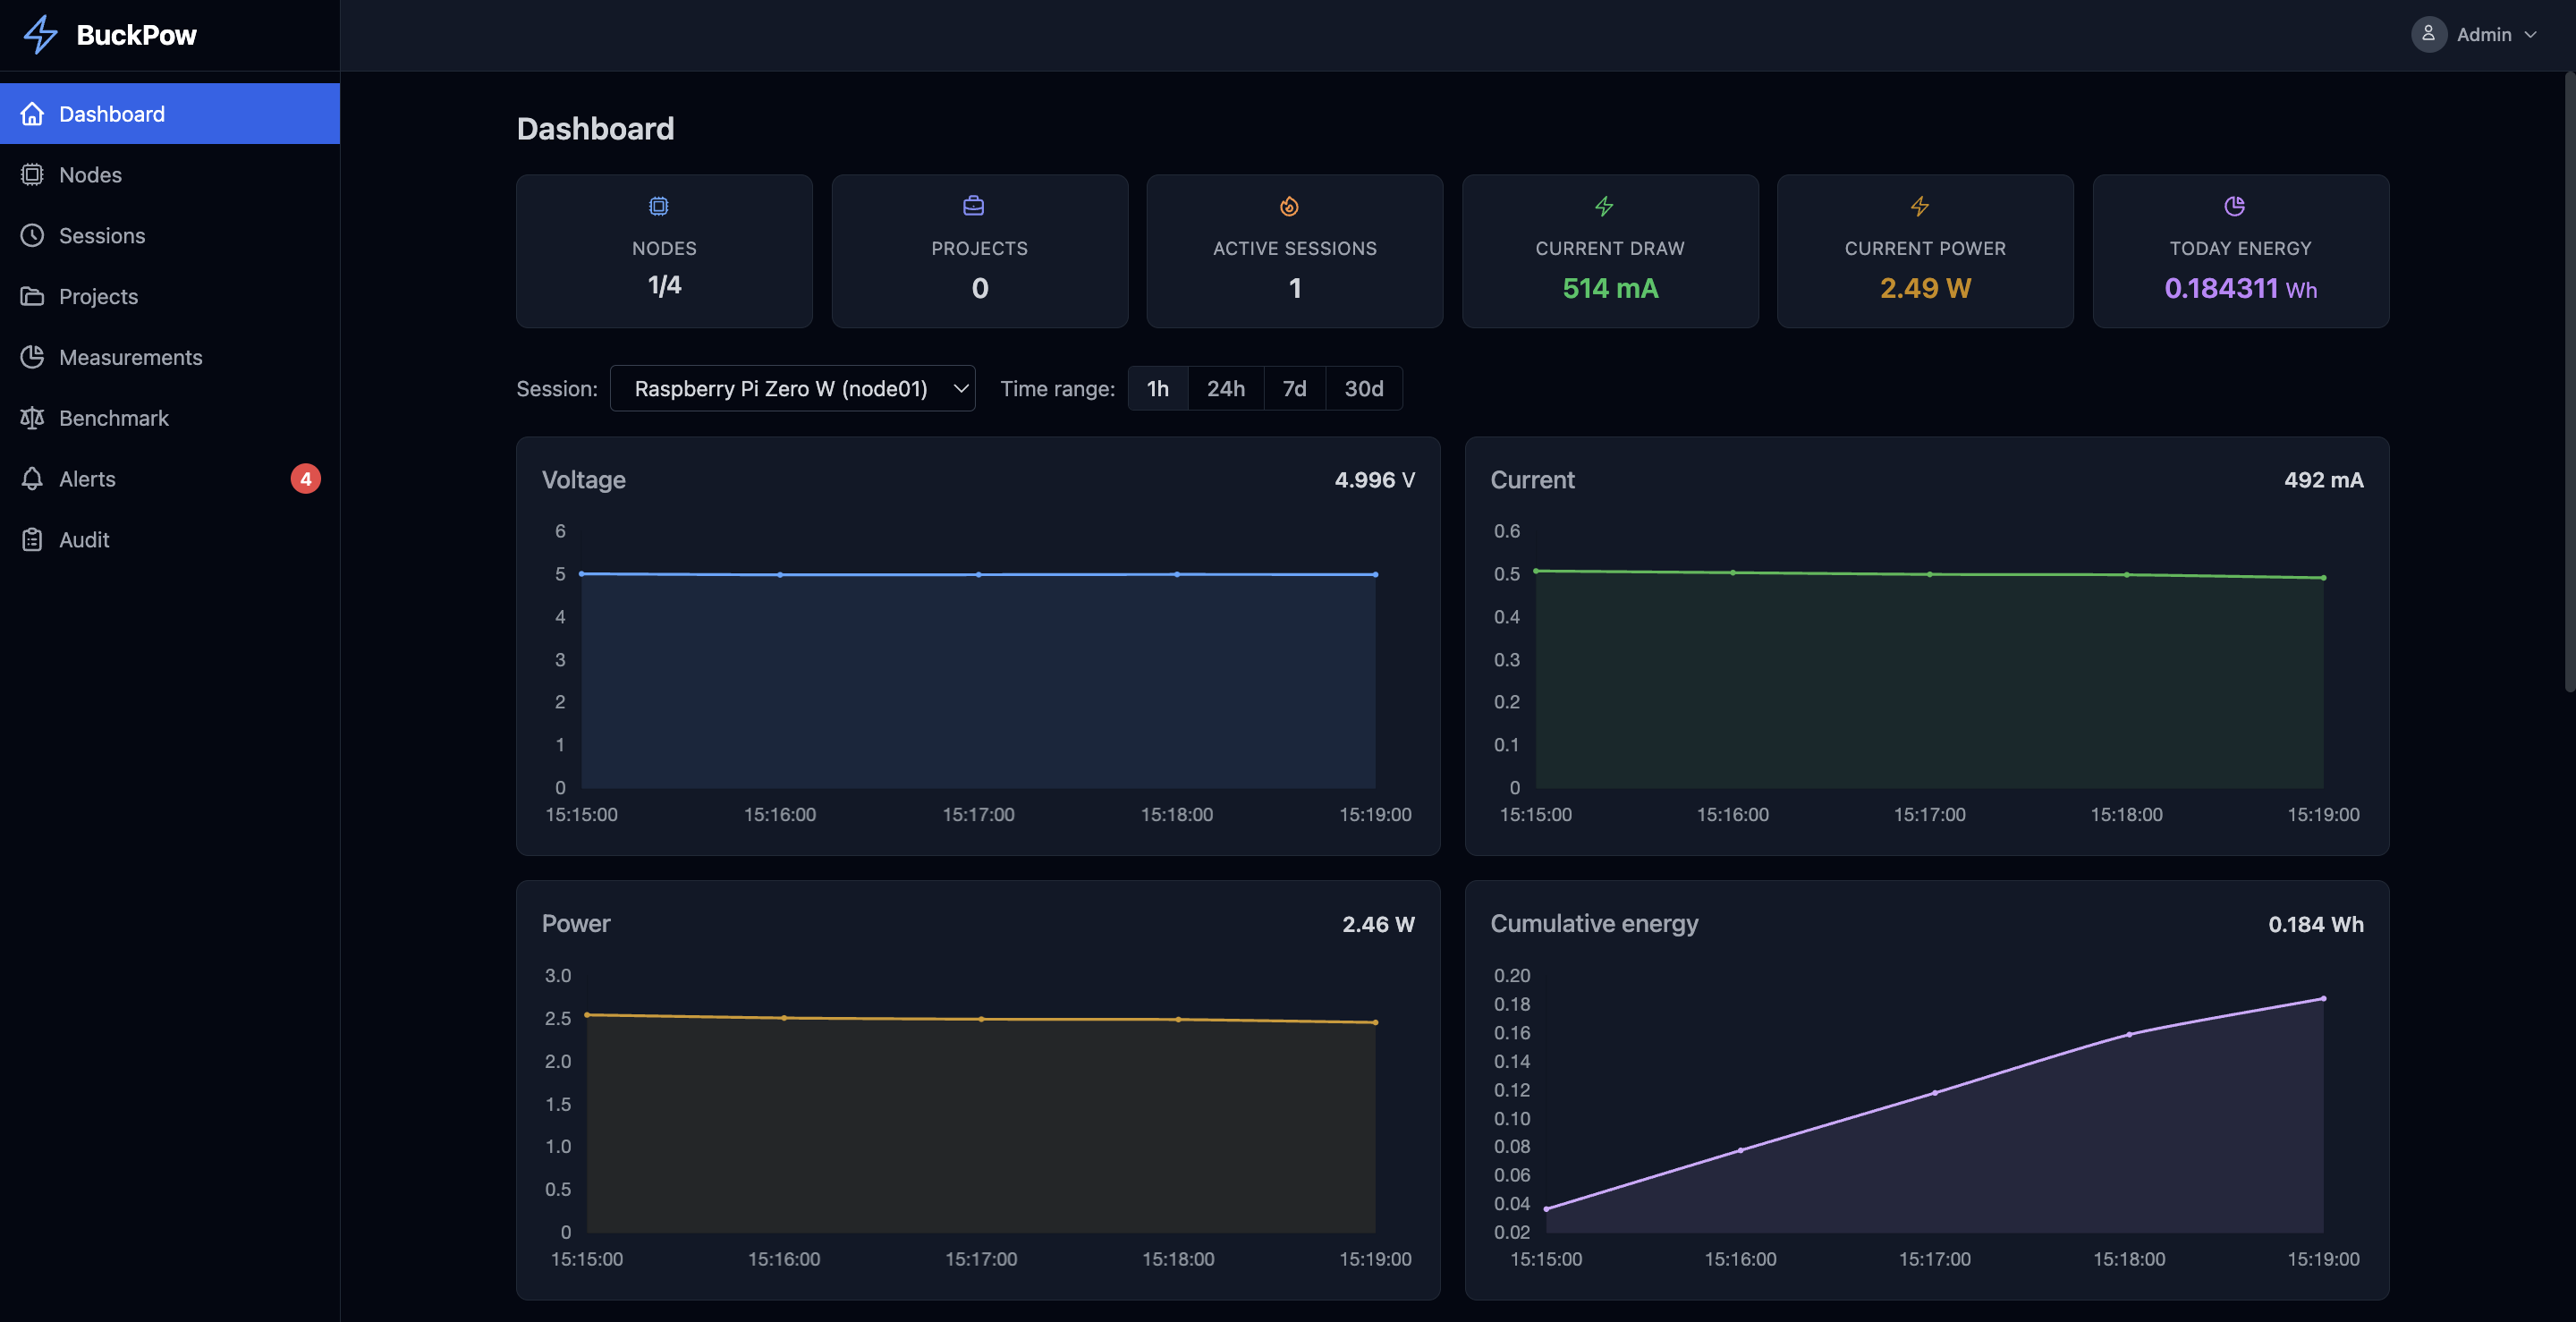
The dashboard is the first page you see after logging in. It displays:
- Live voltage, current, power, and energy charts
- Summary cards with device status and totals
- Statistics with min/max/avg/peak values
- Energy breakdown by hour, day, week, and month
- Recent measurements table
- Session selector for filtering data
All data refreshes automatically every 5 seconds.
Layout
graph TD
    A[Summary Cards] --> B[Session Selector]
    B --> C[Time Range Selector]
    C --> D[Live Charts]
    D --> E[Statistics Cards]
    E --> F[Energy Breakdown Tables]
    F --> G[Recent Measurements Table]
Summary Cards

The top section shows key metrics:
| Card | Description |
|---|---|
| Devices | Online / total device count |
| Projects | Total project count |
| Active Sessions | Number of currently running sessions |
| Today's Energy | Total energy consumed today (Wh) |
Devices are marked as online if they have sent a measurement within the last 30 seconds (configurable via DEVICE_ONLINE_TIMEOUT).
Session Selector
The session dropdown lists all running sessions. Selecting a session filters:
- Chart data
- Statistics
- Energy breakdown
- Recent measurements
If no session is running, the charts show empty state.
Auto-refresh
The session list refreshes automatically. New running sessions appear without page reload.
Time Range Selector
Four time ranges are available for chart data:
| Range | Granularity | Data Points |
|---|---|---|
| 1h | Minutes | Up to 60 |
| 24h | Hours | Up to 24 |
| 7d | Days | Up to 7 |
| 30d | Days | Up to 30 |
Click a time range button to switch. The active button is highlighted.
Live Charts
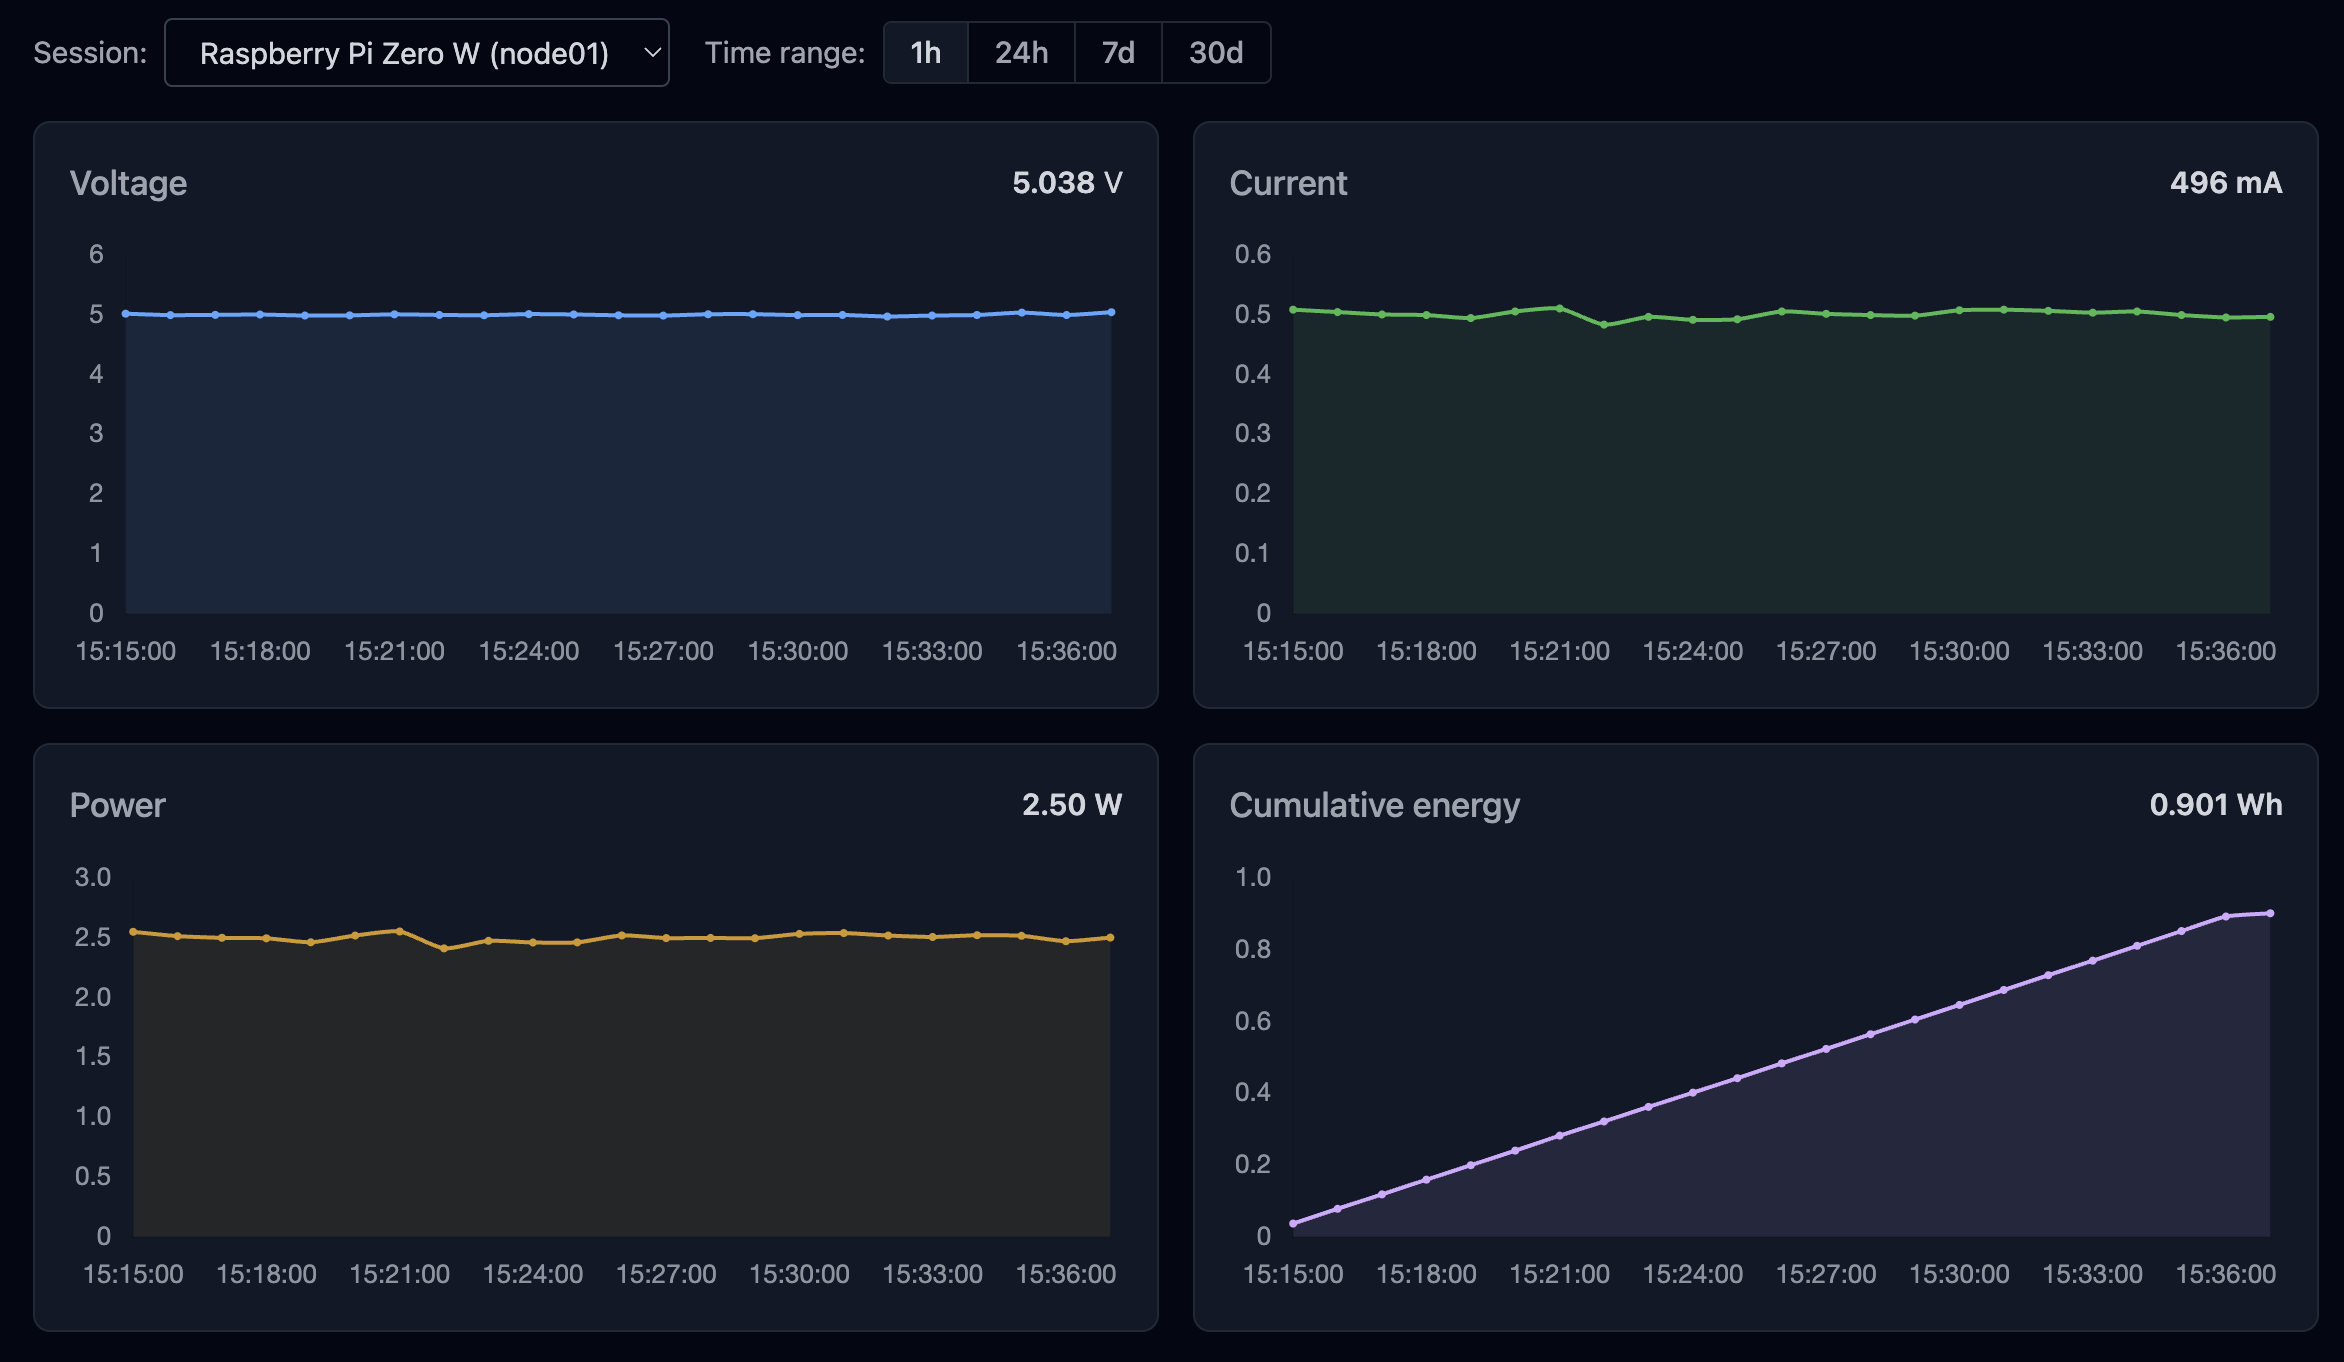
Four real-time line charts display measurement data:
Voltage Chart
- Label: Voltage (V)
- Color: Blue
- Shows: Bus voltage over time
Current Chart
- Label: Current (A)
- Color: Green
- Shows: Current draw over time
Power Chart
- Label: Power (W)
- Color: Yellow
- Shows: Power consumption over time
Energy Chart
- Label: Energy (Wh)
- Color: Purple
- Shows: Cumulative energy consumption over time
Each chart shows the latest value in the header. Charts update every 5 seconds with new data from the selected session.
Statistics Cards
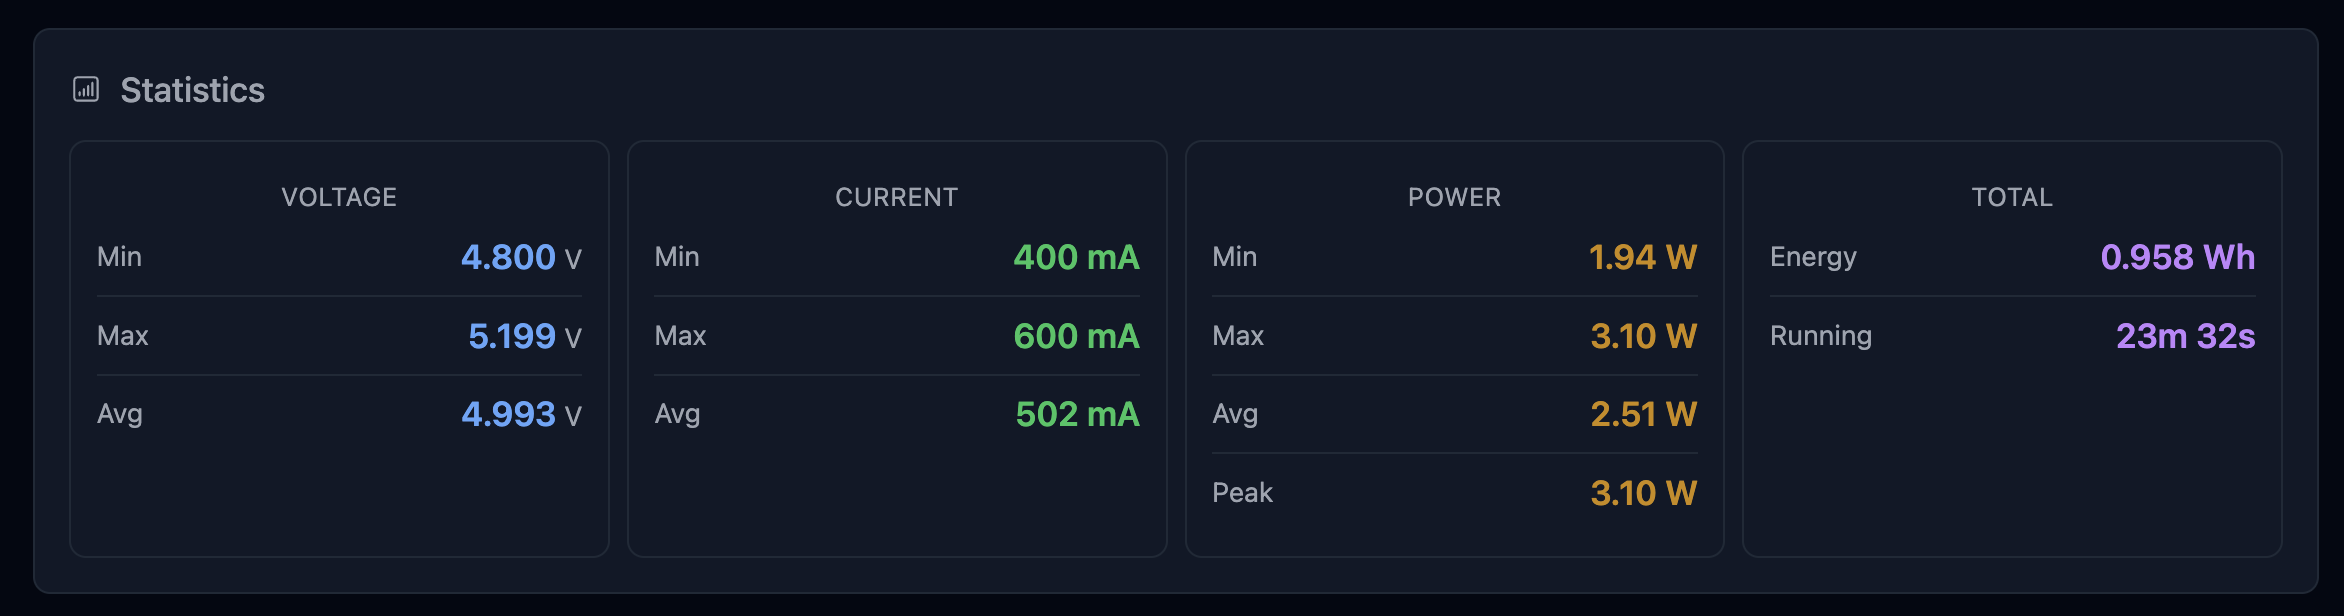
Below the charts, four stat cards show aggregated metrics:
Voltage Stats
| Metric | Description |
|---|---|
| Min | Minimum voltage in the selected time range |
| Max | Maximum voltage in the selected time range |
| Avg | Average voltage in the selected time range |
Current Stats
| Metric | Description |
|---|---|
| Min | Minimum current in the selected time range |
| Max | Maximum current in the selected time range |
| Avg | Average current in the selected time range |
Power Stats
| Metric | Description |
|---|---|
| Min | Minimum power in the selected time range |
| Max | Maximum power in the selected time range |
| Avg | Average power in the selected time range |
| Peak | Peak power in the selected time range |
Total Stats
| Metric | Description |
|---|---|
| Energy | Total energy consumed (Wh) |
| Running | Session duration (if a session is active) |
Energy Breakdown
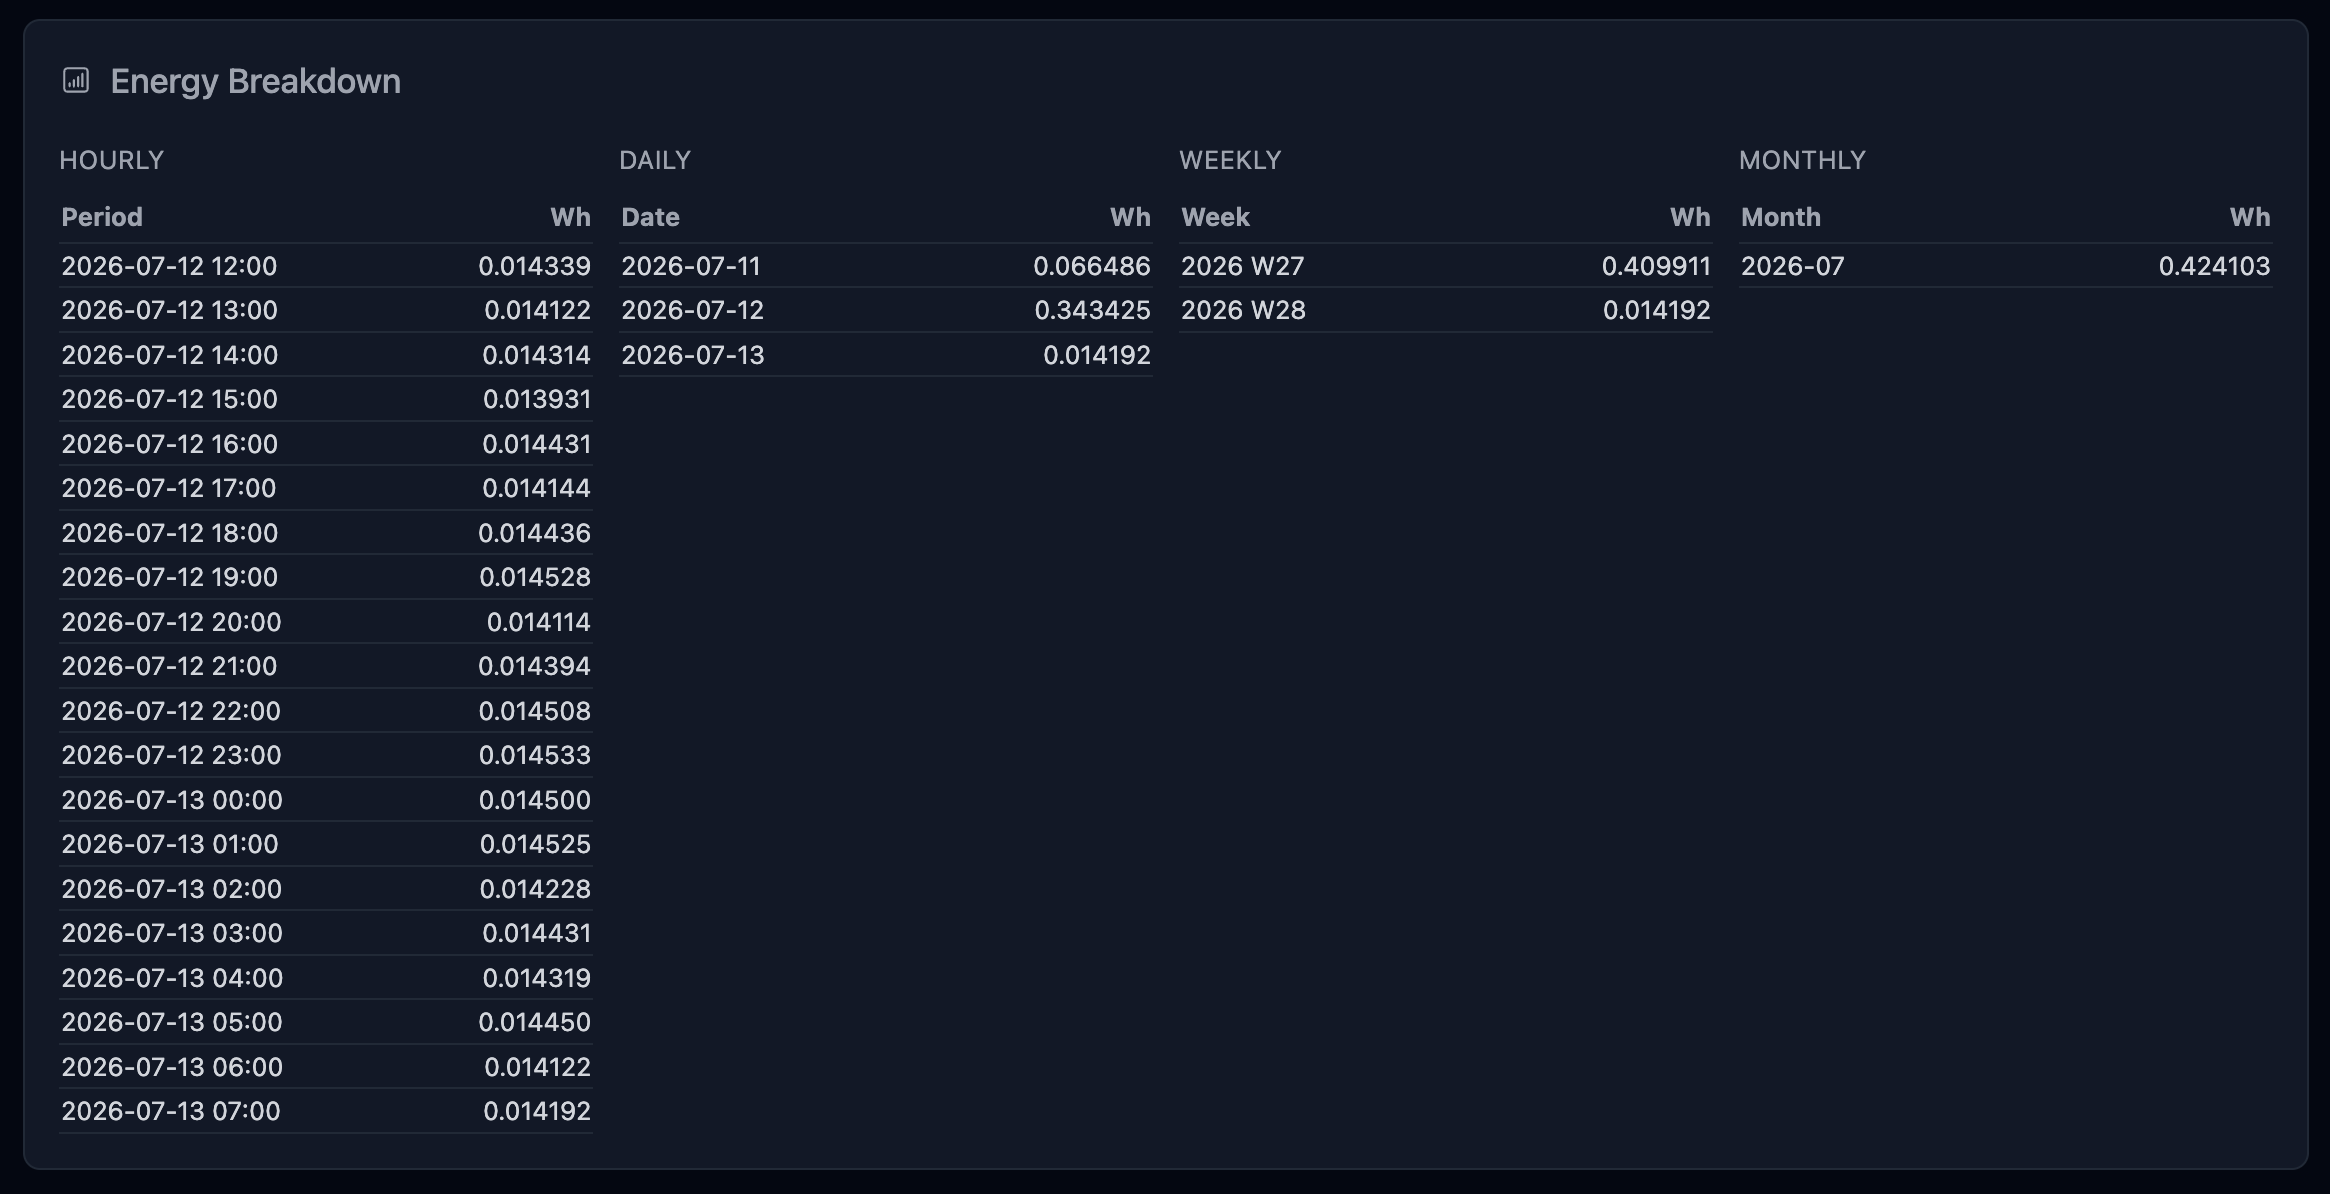
Four tables show energy consumption over different time periods:
| Table | Description |
|---|---|
| Hourly | Energy per hour (last 20 hours) |
| Daily | Energy per day (last 20 days) |
| Weekly | Energy per week (last 20 weeks) |
| Monthly | Energy per month (last 20 months) |
Each row shows the period and energy in Wh.
Recent Measurements
A table displays the 10 most recent measurements for the selected session:
| Column | Description |
|---|---|
| Time | Relative timestamp (e.g., "5s ago") |
| Session | Session name (or — if none) |
| Bus Voltage | Bus voltage in V |
| Shunt Voltage | Shunt voltage in V |
| Load Voltage | Load voltage in V |
| Current | Current (auto-scaled: µA, mA, or A) |
| Power | Power (auto-scaled: µW, mW, W, or kW) |
| Energy | Cumulative energy (auto-scaled: Wh or kWh) |
Navigation
The sidebar provides access to all dashboard pages:
| Page | Description |
|---|---|
| Dashboard | Real-time overview (current page) |
| Nodes | Manage nodes and API keys |
| Sessions | Experiment session management |
| Measurements | Paginated readings with date filter |
| Projects | Project organization |
| Benchmark | Session comparison |
| Alerts | Alert management and resolution |
| Settings | Thresholds, theme, timestamps |
| Profile | User profile editing |
| Audit Log | System audit trail |
Dark Theme
Click the theme toggle in the navigation bar to switch between:
- Light mode — Default light theme
- Dark mode — Dark background with light text
- System — Follows your OS preference
Your preference is saved to localStorage and persists across sessions.
HTMX Navigation
BuckPow uses HTMX for SPA-like page transitions. Clicking navigation links loads pages without full browser refreshes. JavaScript re-initializes automatically after each page swap.